Are you trying to make sense of Pompano Beach housing headlines that seem to change every month? You are not alone. Between seasonality, condo rules, and insurance costs, it can feel hard to know what really drives prices and timing here. In this guide, you will learn the key metrics, how to read them in Pompano Beach, and what they mean for your next move. Let’s dive in.
Key market metrics to know
Median price and price per sqft
- The median sale price is the middle closed price. It shows a typical sale and avoids outliers. Use it to track overall direction.
- The average price can be skewed by very high or very low sales. Treat it as a secondary view.
- Price per square foot helps you compare similar homes or condos quickly. Use it within the same property type and neighborhood, not across very different home types.
Inventory and months of inventory
- Active inventory is how many homes are listed for sale right now. New listings track what came to market this month.
- Closed sales count deals that finished in a given month. Pending or under contract shows accepted offers still in process.
- Months of inventory equals active listings divided by the average monthly closed sales. As a rule of thumb:
- Less than 3 months suggests a seller’s market.
- 3 to 6 months suggests a balanced market.
- More than 6 months suggests a buyer’s market.
Days on market and negotiation pressure
- Days on market (DOM) is how long a home took to go under contract. Falling DOM suggests stronger demand or better pricing.
- List-to-sale price ratio compares the final sale price to the original list price. Ratios near or above 100 percent point to firmer pricing power.
What makes Pompano Beach different
Seasonality and winter demand
Pompano Beach follows a clear seasonal rhythm. Buyer activity often rises from November through April as seasonal residents arrive. That can mean more showings, quicker offers, and stronger list-to-sale ratios. Summer and hurricane season can bring softer traffic and more price sensitivity, so strategy often shifts with the calendar.
Condo and single-family dynamics
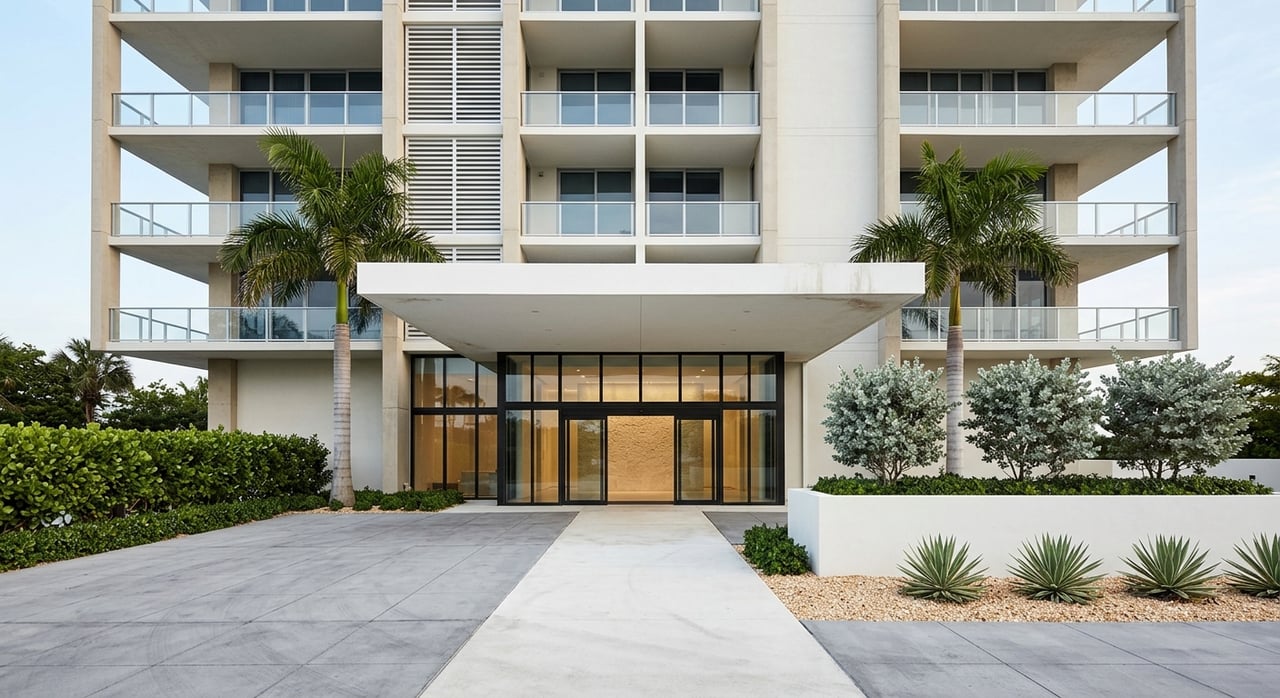
Condos make up a large share of local inventory, especially along the beach and Intracoastal. They can show different pricing and timing than single-family homes because of association rules, lending standards, and insurance. It is smart to review condo and single-family stats separately. Waterfront single-family homes often command higher price per square foot and can have longer days on market because of price point and buyer selectivity.
Insurance, flood zones, and financing
Coastal risk is part of life in Broward County. Flood zones, wind exposure, and building age can influence insurance availability and premiums, which affect affordability. Condos may face association policy changes, reserve requirements, or special assessments that shape buyer demand. Mortgage rate changes also move the buyer pool quickly, and some condos require specific financing approaches or cash.
Investors and rental demand
Pompano Beach attracts investors looking at long-term and vacation rentals near the beach and marinas. Investor activity can mean more cash offers in certain condo price tiers and shorter DOM for well-located units. Rental yield expectations and association rental rules often drive which buildings see the most investor interest.
How to read today’s signals
Scenario A: Low inventory, faster sales, prices rising
This pattern often appears during winter. Sellers can list with confidence when marketing and pricing are aligned. Buyers should be pre-approved, review comps quickly, and be ready to make clean, timely offers.
Scenario B: Inventory up, DOM rising, prices leveling
You may see this in late spring or summer, or after insurance or financing shifts. Buyers gain negotiating room. Sellers should revisit pricing, condition, and concessions to keep showings active.
Scenario C: Condo market slower than single-family
If condo DOM climbs and list-to-sale ratios slip, association rules, financing standards, or insurance costs may be weighing on demand. Single-family homes, especially renovated or waterfront, can still move on a different timeline. Analyze by property type before deciding on price.
Timing and strategy
If you are selling
- List near the seasonal demand surge when possible, but watch your segment’s competition.
- Price by months of inventory in your price band, not the citywide median.
- Track the pending-to-active ratio in your area. If few listings are going under contract, price with more cushion.
- Improve condition and marketing. Even in a fast winter market, presentation matters.
If you are buying
- Compare a listing’s DOM to the neighborhood median DOM. High DOM plus recent price cuts usually signals negotiating room.
- Segment comps by property type and condition. Do not compare a remodeled unit to an original-condition unit.
- Factor insurance and HOA costs into monthly affordability. For condos, review reserves, assessments, and rental policies early.
- In a tight winter market, consider pre-inspections and flexible timelines to strengthen your offer.
Neighborhood and price tier nuance
Citywide medians hide different submarkets. Beachfront and Intracoastal areas command premiums because of location and boating access, while inland neighborhoods often offer more value per square foot. Entry-level condos may move faster with investor interest, while luxury waterfront homes can show longer marketing times. Always analyze by ZIP code or subdivision, by price tier, and by property type.
How to track the market
Here is a simple checklist you can use each month:
- Check whether numbers are for one month or a rolling average.
- Separate single-family and condos before comparing price trends.
- Compare new listings to closed sales to see supply versus demand.
- Calculate months of inventory in your price range.
- Review the 12 and 24 month trend for median price and DOM to filter out seasonality.
- Note the count of price reductions and the average days to contract for nearby listings.
Ready to plan your move?
Whether you want to sell a beachfront condo, buy an Intracoastal home, or underwrite a rental-friendly property, you deserve clear, local advice. Our boutique team blends residential brokerage with hospitality-grade rental operations, so you can evaluate both resale value and income potential with one trusted partner. If you want a tailored plan for timing, pricing, and rental strategy, connect with Walker Realty & Investments to schedule your free market and rental analysis.
FAQs
Do homes sell faster in winter in Pompano Beach?
- Yes, winter months often bring stronger buyer traffic and shorter days on market, especially for well-priced homes and condos.
How do insurance costs affect buyers and sellers?
- Higher flood and wind premiums can reduce affordability, narrow the buyer pool, and require pricing adjustments, particularly for older or coastal properties.
Why is the condo market often different from single-family?
- Condo associations, lending standards, reserves, and rental rules can affect financing and demand, which can lead to different DOM and pricing patterns.
What does days on market tell me about a listing?
- Compare the listing’s DOM to the neighborhood median; longer-than-typical DOM and price cuts suggest more negotiating room.
How should I use months of inventory when pricing?
- Under 3 months indicates stronger seller leverage, 3 to 6 is balanced, and over 6 points to buyer leverage, so set expectations by your price tier.
Where can I find current local numbers?
- Review monthly reports from the local MLS or Florida Realtors, and check Broward County property records for sales history and neighborhood trends.